Analysis of temporal dynamics in signals for predictive maintenance: challenges and new methods
31 March 2022Last month, we returned to the foundations of artificial intelligence and its opportunities for a maintenance 4.0 strategy. Let’s go further by deciphering the challenges of temporal dynamics analysis for predictive maintenance. Focus on a new method of analysis of functional categorical data co-developed by DiagRAMS.
When will a breakdown occur? When did a drift start? How will it evolve? What are the weak signals of an anomaly over time? Is a specific sequence of operating modes the cause of the problem? Is a characteristic pattern of a dysfunction linked to a temporal phenomenon?… These are all questions that relate to temporal phenomena.
This is why the analysis of its dynamics is crucial for predictive maintenance. New methods are available to overcome the limitations of traditional methods.
The challenge of time series analysis for predictive maintenance: traditional methods vs. expert methods
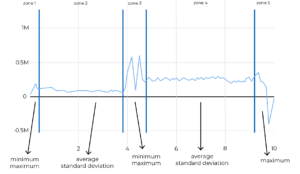
In industry, sensors record data continuously: they are curves of quantitative values (or time series) that are complex to analyse. Traditionally, the information contained in the curves is summarised by descriptors (mean, variance, etc.).
It is also necessary to choose on which period of the curve precisely one wants to extract these descriptors (global descriptors on all the curve together, or descriptors on a precise period). All these transformations and reductions can lead to the loss of a significant amount of information, especially as decisions are based solely on human expertise (introduction of bias).
Applied to predictive maintenance, the challenge is to look for weak signals in the data that may indicate failures.
Thus, traditional Machine Learning methods are not adapted to the analysis of time series, which erase too much information and introduce biases. However, there are expert methods, such as the methods used by DiagRAMS, which make it possible to model these curves without making descriptors and by keeping the temporal information.
On the other hand, for categorical data curves (or categorical functional data), the scientific literature is poorer and no standard method has emerged to analyse and maintain these temporal dynamics.
The challenge of analysing categorical functional data for remaining life prediction and the limitations of current methods
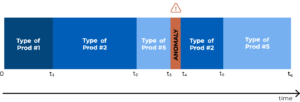
In the field of industrial production, categorical functional data can, for example, describe the context of use and the state of the machine: “healthy” and then “broken”, or “start-up phase” and then “cleaning phase” and then “production context A” etc.
This type of data, which is complex to study, is generally simplified by omitting temporality or by creating new variables, descriptors (time spent down, etc.) in traditional analyses. These methods thus increase the quantity of data while risking a significant loss of information on the monitoring of the state of a machine over time with its evolutions in terms of operation.
In the context of predictive maintenance, we seek to identify, for each piece of equipment, the sequence of operating categories over time, their order of occurrence, but also the duration of each of these operating categories.
This information is important to know because each context of use of the equipment (operating category) can represent a different “severity” of use of the equipment and therefore has an impact on its life. The categorical functional data describing the context of use of the machine and its state can therefore be used to learn the level of severity of use of each of the contexts and, ultimately, to be able to predict the remaining life of the machine.
Today, traditional methods are limited in effectiveness, they do not allow to take into account and qualify how the severity of use is different from one product to another and what are the different contexts of use.
A new method adapted to the analysis of functional categorical data co-developed by DiagRAMS
Preserving the temporal information of categorical functional data is crucial in order to detect patterns characteristic of dysfunction.
« To address this issue and the performance challenges of Machine Learning models, we have developed a new method for analysing functional categorical data. It allows us to encode these data into real values containing all the information on the temporal dynamics » explain Quentin Grimonprez, Head of Data Science & Partner of DiagRAMS Technologies.
The objective is to automatically transform categorical functional data into real variables and to be able to use them together with other types of data (real…) in classical Machine Learning methods while keeping the temporal information.
For maintenance, this method is particularly suitable for analysing the chaining of functional categorical data and thus, in other words, the chaining of equipment function categories.
Thus, the predicted residual life of a piece of equipment (RUL) evolves over time according to the different levels of severity of use associated with the modes of operation and the contexts of stress.
It is therefore necessary to be able to take these elements into account in the analysis in order to be able to learn survival laws based on the chaining of functional categorical data.